In the dynamic world of trading, traders seek effective tools to gain insights into market trends and make informed decisions. One such tool is the WS Trades VPA Indicator. This blog post aims to provide a comprehensive understanding of the WS Trades VPA Indicator, including its functionality and practical applications in trading strategies.
Exploring the WS Trades VPA Indicator: The WS Trades VPA Indicator is a technical indicator designed to analyze market sentiment and volume price analysis (VPA). By incorporating price movement, volume data, and average calculations, this indicator offers valuable insights into market conditions. Its primary objective is to identify bullish or bearish sentiment, assisting traders in making more accurate predictions.
Key Components of the WS Trades VPA Indicator: To grasp the WS Trades VPA Indicator fully, it is essential to comprehend its key components. Let’s explore them in detail:
- Average Length: The “averageLength” parameter determines the number of periods used for calculating the market sentiment calculation. By smoothing out price fluctuations, these averages aid in trend identification.
- Volume Length: The “VolLength” parameter sets the period used for calculating the average volume. This parameter provides insights into volume patterns and their impact on price movements.
- Above average volume for range (AAVFR) and Below average volume for range(BAVFR): The AAVFR and BAVFR parameters serve as multipliers for calculating volume range thresholds. These thresholds highlight price and volume anomalies.
- Components for Market Sentiment: The WS Trades VPA Indicator utilizes several components to determine market sentiment. These include “priceRising” and “volumeRising” variables, which evaluate whether price and volume are rising or falling. Based on these conditions, the indicator classifies sentiment into strongly bullish, weakly bullish, strongly bearish, or weakly bearish categories.
Utilizing the WS Trades VPA Indicator in Trading Strategies: The WS Trades VPA Indicator can be effectively incorporated into various trading strategies. Here are some ways to leverage its capabilities:
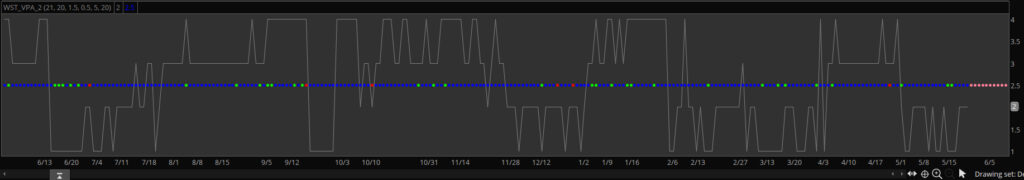
- Identifying Market Sentiment: The indicator assigns numerical values to market sentiment, ranging from strongly bullish (4) to strongly bearish (1). By monitoring these sentiment levels, traders can gauge the overall market mood and adjust their trading strategies accordingly.
- Analyzing Volume and Price Movements: The WS Trades VPA Indicator considers both volume and price movements, offering insights into their correlation. Traders can use this information to identify instances of volume divergence, which may indicate potential trend reversals or continuation.
- Establishing Thresholds and Confirming Signals: The indicator’s “horizontalLine” represents a threshold for traders. It changes color based on the volume range, with red indicating low volume relative to the price range and green representing high volume relative to price range. By utilizing these thresholds, traders can validate entry or exit signals generated by other trading tools.
The WS Trades VPA Indicator serves as a valuable tool for traders seeking to analyze market sentiment and volume price analysis. By comprehending and effectively utilizing this indicator, traders can enhance their decision-making process and improve the accuracy of their trading strategies. It is important to remember that technical indicators should be used in conjunction with other forms of analysis and risk management strategies to optimize trading outcomes.
DOWNLOAD: https://tos.mx/1TQFZNC
Here is the link to my favorite book about VPA: https://amzn.to/3OK4RFp