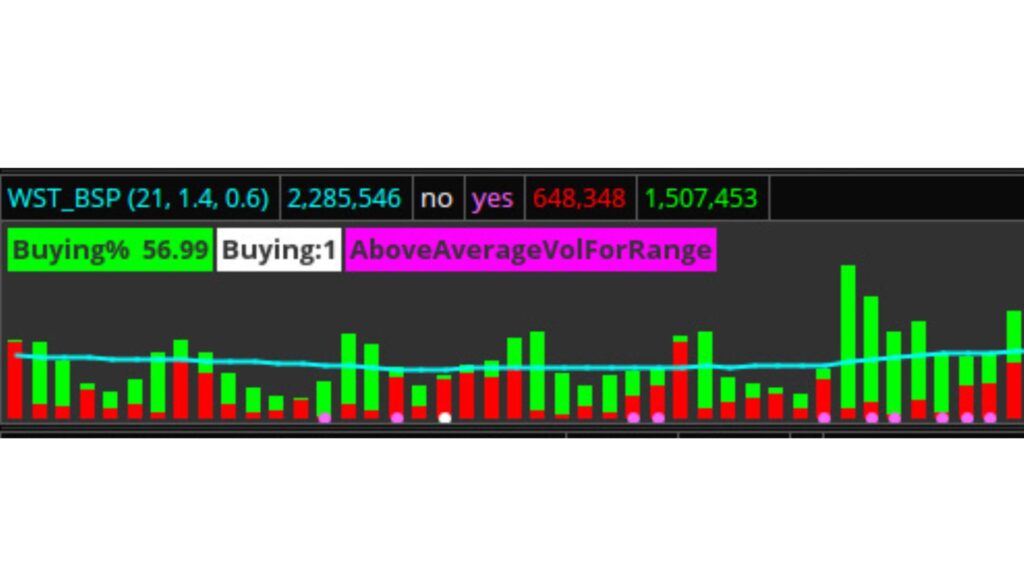
This lower indicator is a quick visual way to see if buyers or sellers are in control of a security. Each bar shows red (selling pressure) and green (buying pressure) as well as the percentage of buying or selling pressure on the current bar and the trend of the pressure if any in labels on the left side. There is also a blue horizontal line that is the average volume for the period. The default period is 21 but can be set to whatever range that fits your trading style. I also added points under each bar and a label to show when a bars range isn’t consistent with the volume needed to cause the range of the bar (Wyckoff method). It will either be magenta for Above average volume for the range of the bar or white for Below average volume for the bar. You can adjust the percentage that you consider highly unusual. Stock setting is 50% above or below the average.
Desktop DOWNLOAD: https://tos.mx/UrOUWtB
Mobile DOWNLOAD: https://tos.mx/VkpaOVo
Mobile workaround, This the best volume indicator workaround I could make that works with ToS mobile. The Green is overall volume. The red is the selling pressure and the cyan line average volume. The purple dots are above average volume for range and the yellow dots are below average volume for range of the candle.
