Scanners to help you find great stock or options setups.
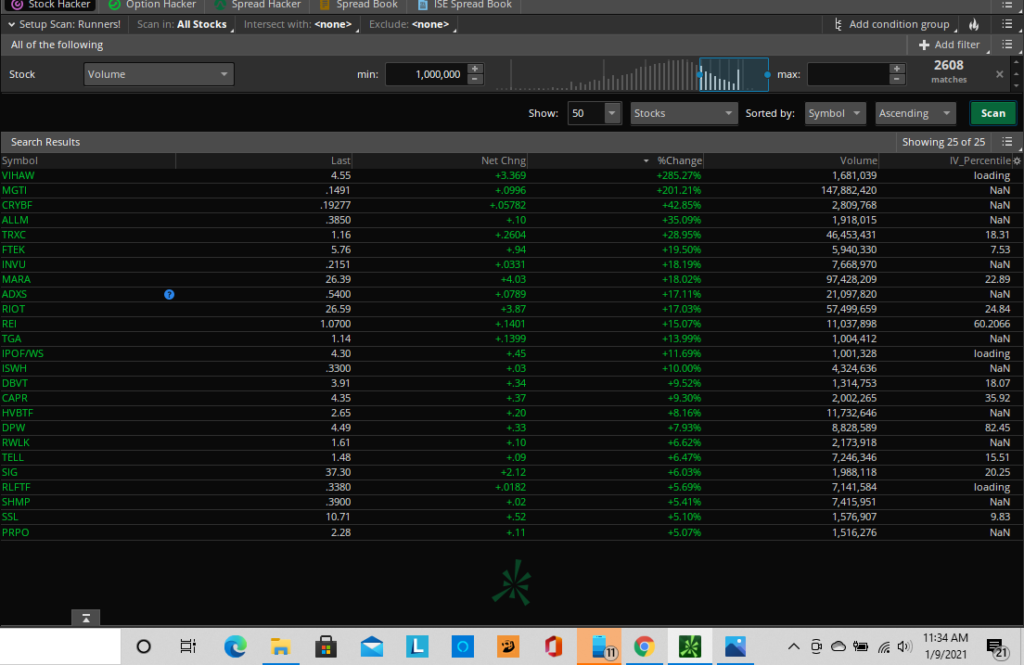
Runners Scanner For TOS
Runners scanner scans for stocks that are showing unusual volume and up a certain percentage. FREE!

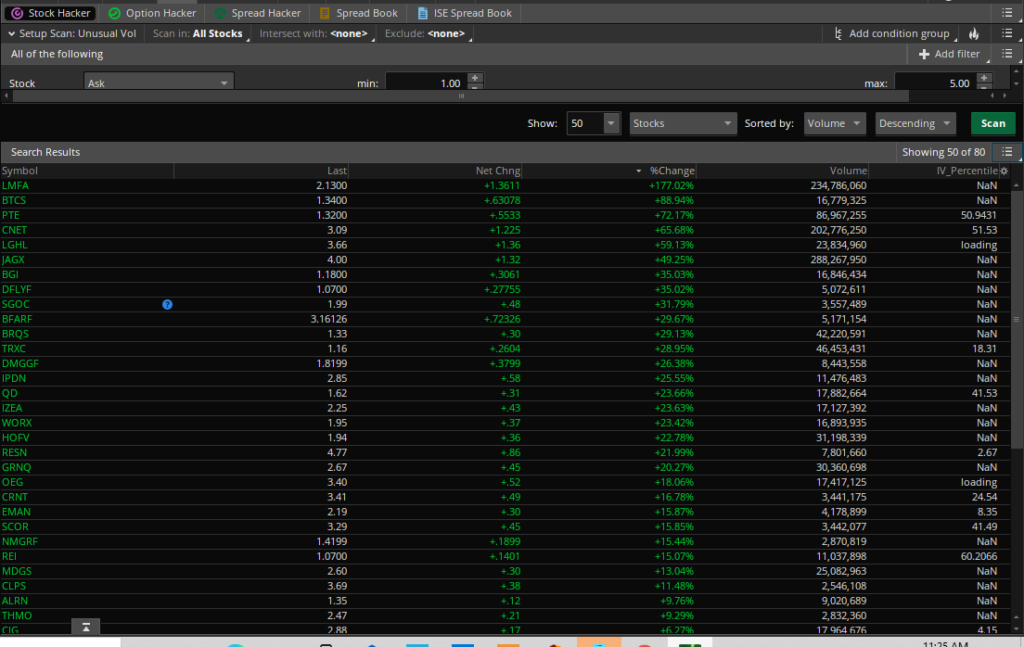
Unusual Volume Scanner
This powerful scanner consistently picks up huge gainers or losers. Best for quick day trades. FREE!
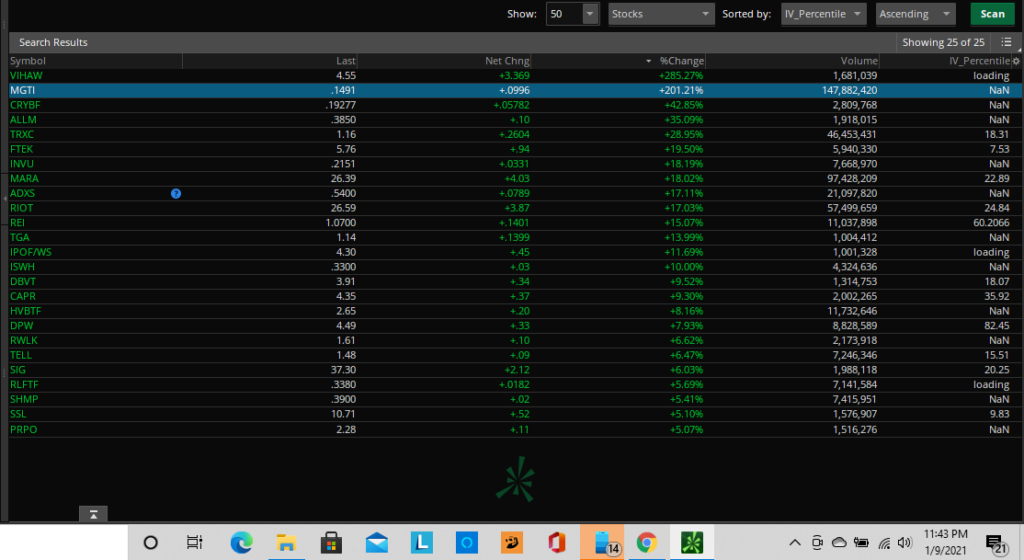
High IV Options
Great scanner for finding high IV options plays. FREE!
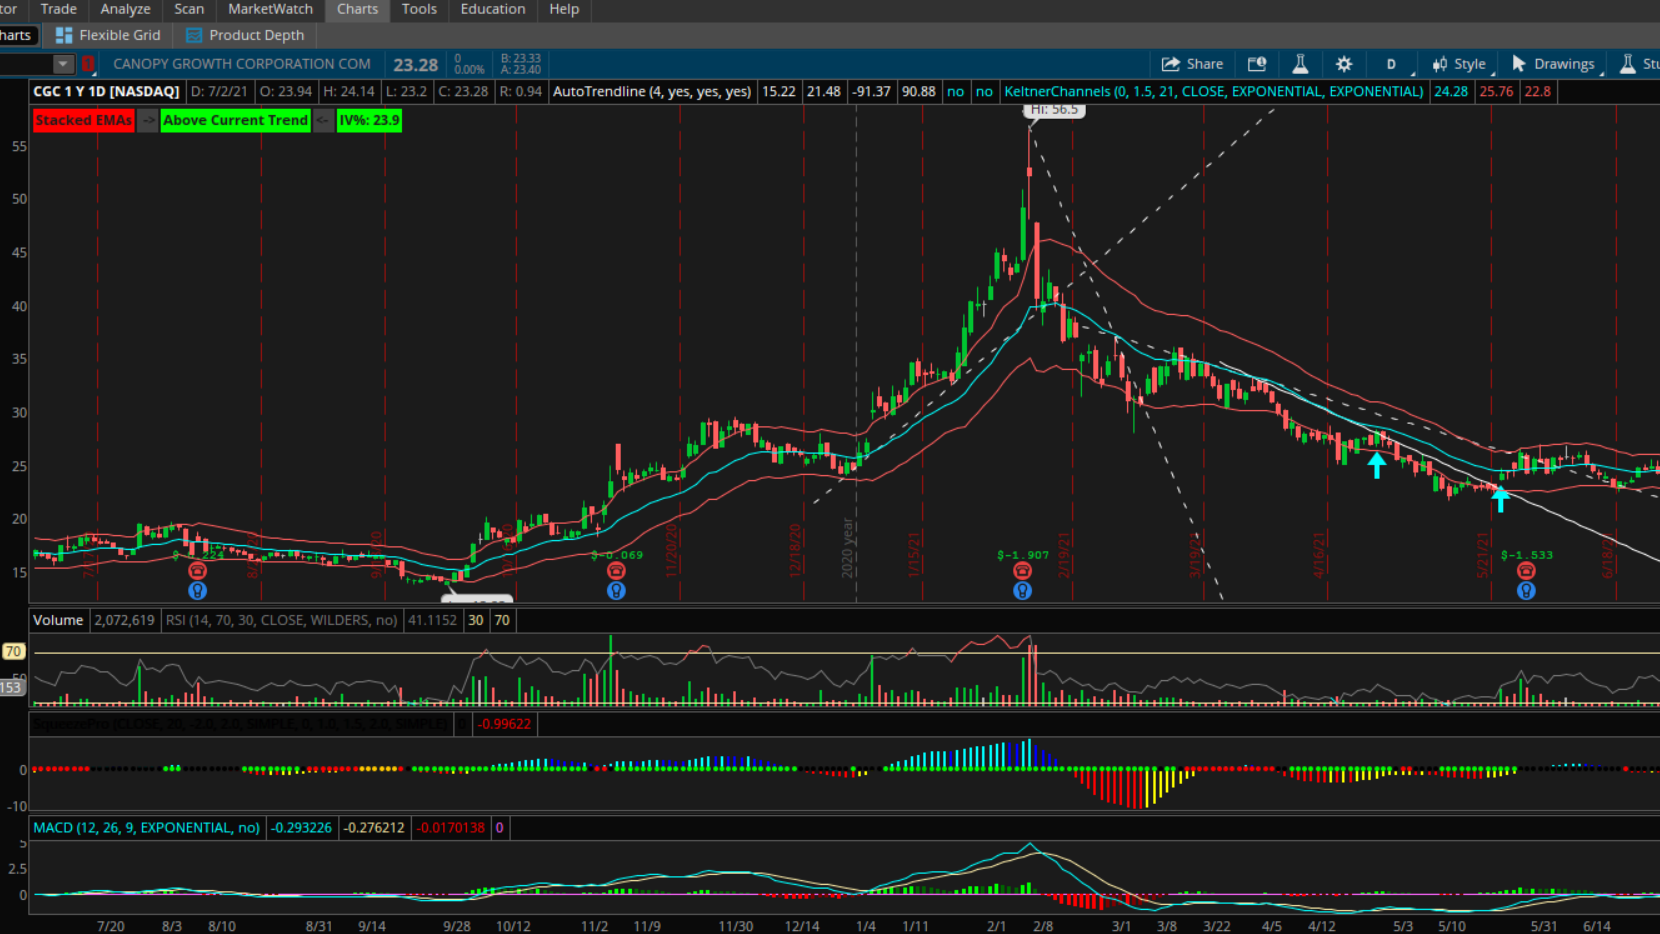
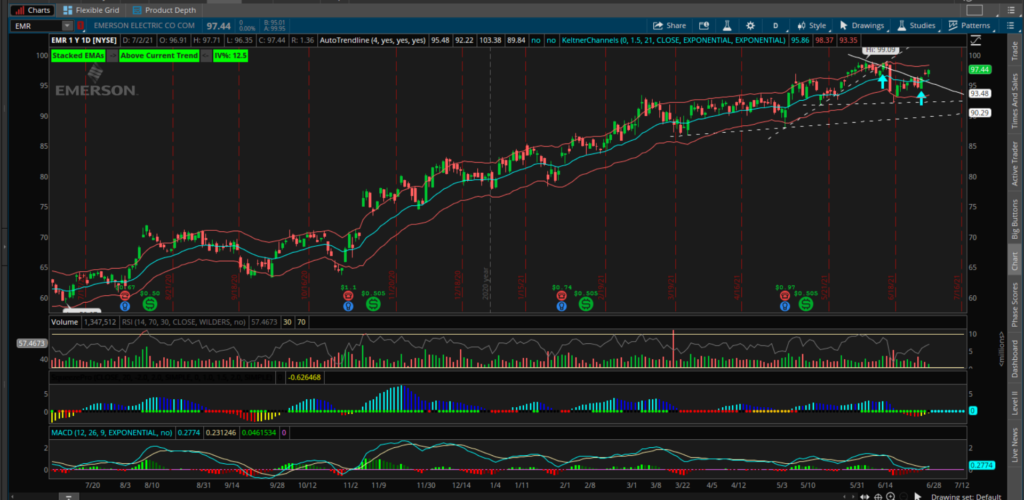
21 EMA Bullish
This Scanner picks up tickers that are close to but above the 21 EMA and bullishly stacked EMAs. FREE!
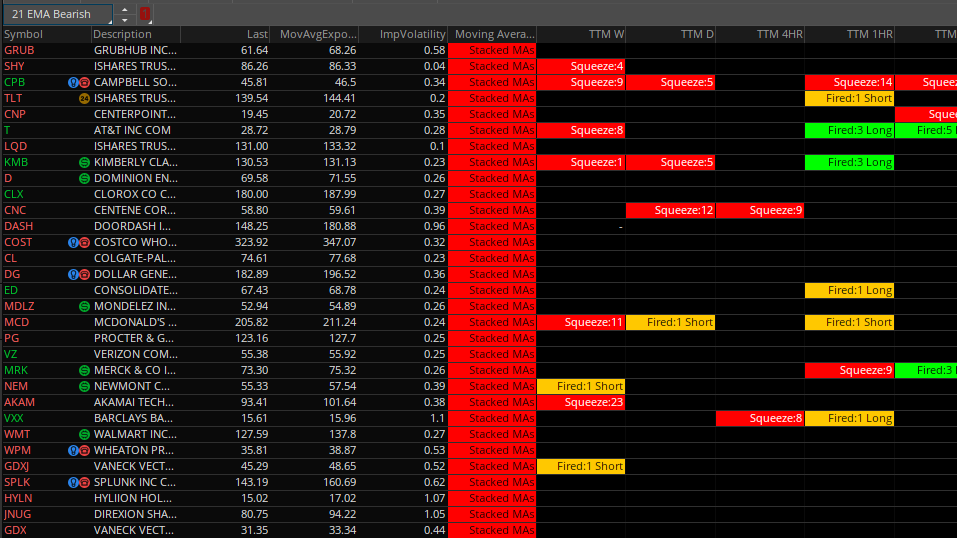
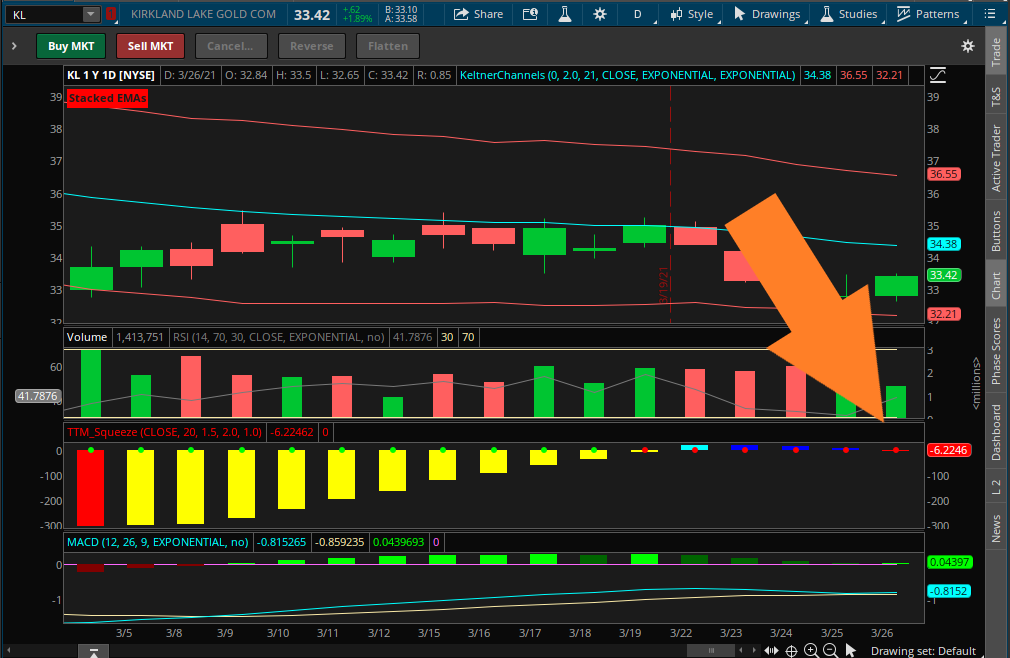
21 EMA Bearish
This scanner picks up tickers that are close to but below the 21 EMA and has bearishly stacked EMAs FREE!

Stacked EMA Chart Label
This Thinkscript study will allow you to quickly identify if EMAs are stacked bullishly, bearishly or not stacked. FREE!
Stacked EMA Label For TOS Mobile
This study will allow you to identify if the EMAs are stacked on the ThinkorSwim mobile app. A 1.00 is bullishly stacked, a 0.00 is not stacked EMAs and a -1.00 means the EMAs are stacked bearishly. FREE!

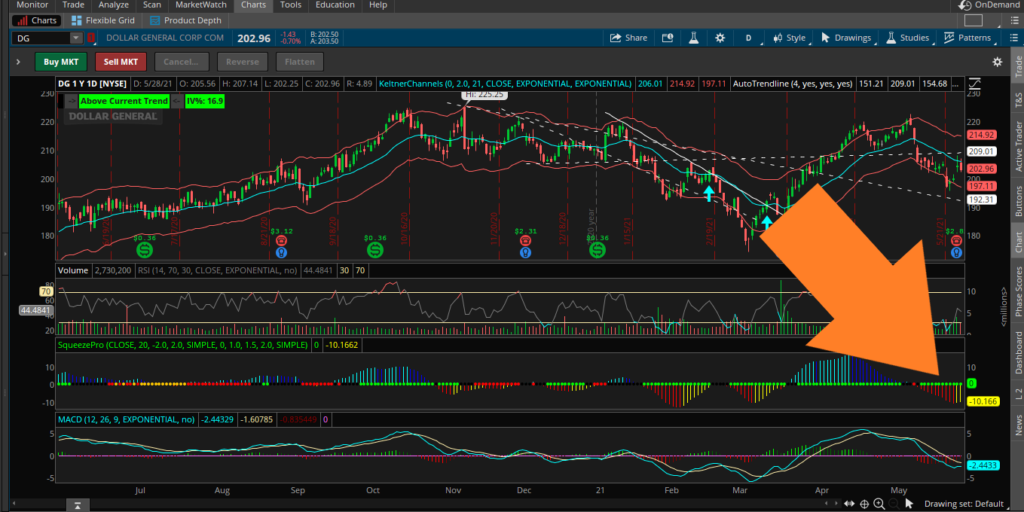
TTM Zero line crossover Bearish
This scanner picks up stocks and ETFs that have just crossed over the zero line from bullish to bearish with bearishly stacked EMAs.

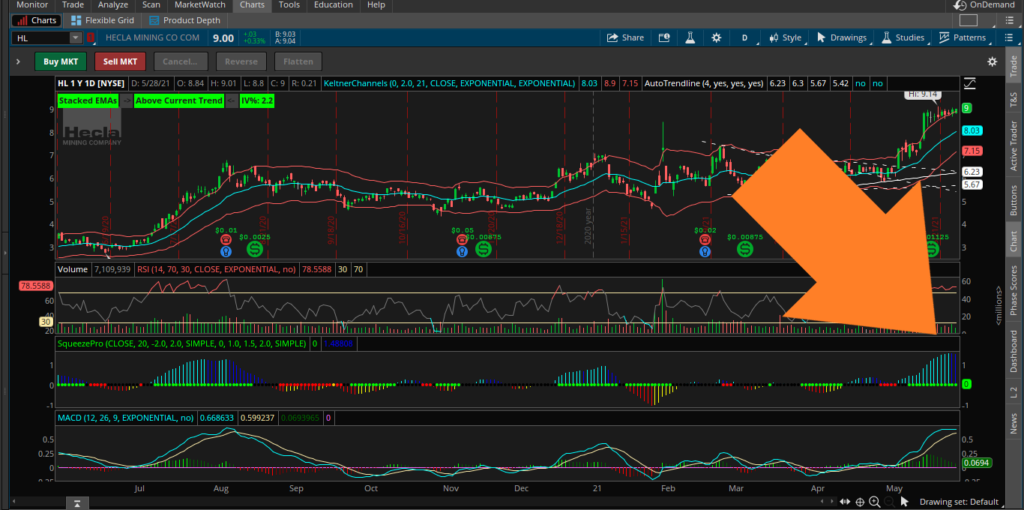
TTM Zero line crossover Bullish
This scanner picks up stocks and ETFs that have just crossed over the zero line from bearish to bullish with bullishly stacked EMAs.

Bullish Stacked EMAs with RSI Oversold
This scanner picks up stocks that have bullishly stacked EMAs but are oversold on the RSI.

Bearish Stacked EMAs with RSI Overbought
This scanner picks up stock that has bearishly stacked EMAs but is overbought on the RSI.

ATR Cloud Study
This study draws clouds from 1 to 4 ATR and -1 to -4 ATR so you can easily see where an underlying is trading compared to its average range.

TTM Histogram Bullish
This scanner picks up stocks that have went from red to yellow (Negative momentum below the zero line to positive momentum below the zero line) From 2 bars ago.

TTM Histogram Bearish
This scanner picks up stocks that have went from cyan to blue on the TTM histogram (Positive momentum above the zero line to negative momentum above the zero line) within 2 bars.

Golden Bull
This scanner will pick up stock that has bullishly stacked EMAs, is trading above the 21 EMA and the MACD has crossed to the bullish side.

Golden Bear
This scanner picks up stocks that have bearishly stacked EMAs, is trading under the 21 EMA and the MACD has crossed under to the bearish side.

This ThinkorSwim study will add a label to your charts that displays if the SAR indicator is bullish or bearish and the value. If you know about the Parabolic SAR indicator then you know that the dots of it will appear either above or below the candles and the value of it is where your stop loss would be placed. Remember that this indicator only works with trending stocks and should not be used by itself.
WS Trades RSI Laguerre Auto-Adjusted with Fractal Energy (Mobius original, Modified by WS Trades)

This code was made by Mobius (the thinkscript legend) and modified by me. I added the color dots on the center line. Basically if the dots are green the price action will likely follow the trend of the RSIL (cyan line on the indicator). Red means there will probably be some sideways movement or some chop but no trend. Yellow is a heads up that a change may be coming. Its not perfect but I am constantly updating it to clean it up a bit. I implore anyone interested in this indicator to read this “how to” from the original source at https://usethinkscript.com/threads/rsi-in-laguerre-time-self-adjusting-with-fractal-energy-usage-notes.219/
WST Download at: https://tos.mx/ZNJGzBU
WST MACD + TTM Squeeze Pro Lower with label

I don’t like a lot of clutter on my charts and two of my favorite lower indicators is the MACD and the TTM Squeeze. I combined them to take up less space. I also added the MACD label on the top left side because it gets hard to see if the lines are really close to crossing.
Expected Daily Move label


This label shows the expected move based off of the annual IV of an underlying. You can change the settings to show either a dollar amount move or what the price will be for a bullish move or bearish move. Please visit YouTube Link to see how to change it.
WST Trend Strength
This lower thinkorswim indicator measures the angle of 4 EMAs (all 4 EMAs can be customized by the user). The default setting for a “strong” trend is set at .5 but that too can be customized by the user. Default EMAs are set because my go to time frame is the daily chart so I have 1(1day), 5 (5 trading days in a week), 21 (20 to 21 trading days in a month), 253 (253 trading days in a year). The Idea is the more time frames that matech up the stronger the trend. Green = strong up trend, dark green = up trend, red = strong down trend, dark red = down trend.

WST VDL
This ThinkorSwim indicator plots a green up arrow or red down arrow on the candle chart. THESE ARE NOT BUY AND SELL SIGNALS. The arrows are plotted when the customizable trend is identified and there is a higher than average volume (also customizable) behind the trend. The trend calculated by the average slope coefficient of trendlines whose start points are mid body value for a specified number of bars and end points are value for current bar. If the slope is positive then the trend is considered ascending. If it the trend is negative then it is considered descending.
