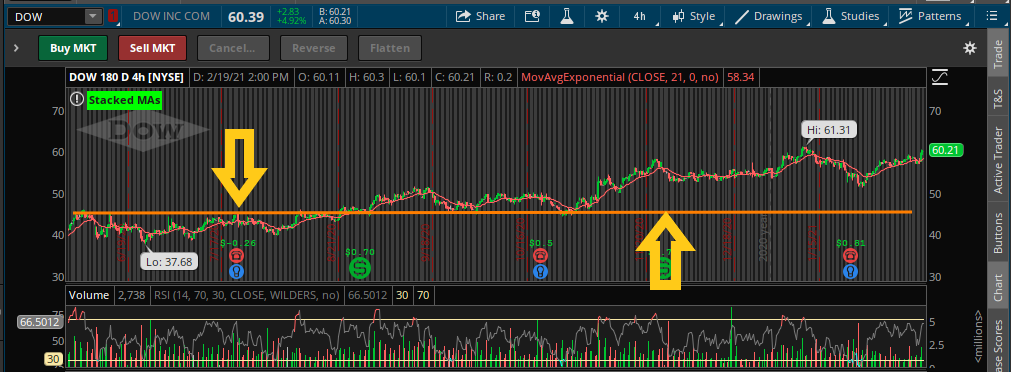
In simple terms support is the price at which a stock finds support and will stop declining and start consolidating ( a phase when a stock or an index trades within a range or sideways.) or start a move to the upside.
Resistance is where a stock is having trouble moving above a certain price.

As you can see above, AAPL came down and touched this support level and bounced upwards 4 times before making a massive move higher.

As you can see from the above picture, MSFT has hit this resistance level 3 times before getting beat back down.
How to find support and resistance
Finding a support or resistance level is very easy. It can be done for any timeframe. The longer the timeframe, the stronger the level will be. I prefer the daily chart for most of my plays. First pull up a chart of a stock you are looking into. Next look for a price level that the stock has hit several times and either bounced back up (support level) or hit and sold off lower (resistance level). Most trading platforms have drawing tools that will allow you to draw a permanent line so that you can reference the level later. Typically once a stock breaks through a support or resistance level, the support level will become resistance or the resistance level will become support.


I am trying to buy your product, but it won’t let me. Can someone there help?
Thanks,
Lauri
Are you trying to signup for the premium membership or the FTT indicator for ThinkorSwim?