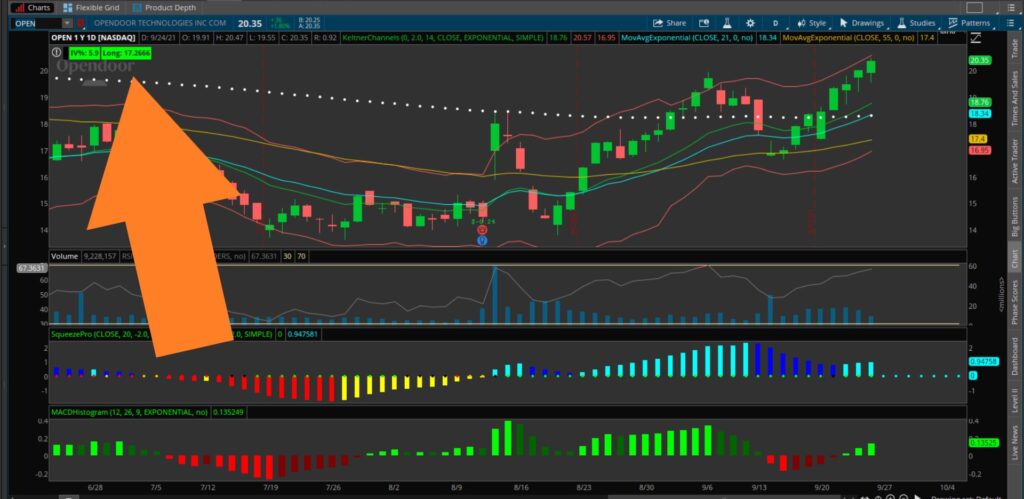
This ThinkorSwim study will add a label to your charts that displays if the SAR indicator is bullish or bearish and the value. If you know about the Parabolic SAR indicator then you know that the dots of it will appear either above or below the candles and the value of it is where your stop loss would be placed. Remember that this indicator only works with trending stocks and should not be used by itself.

