This study draws clouds from 1 to 4 ATR and -1 to -4 ATR so you can easily see where an underlying is trading compared to its average range.
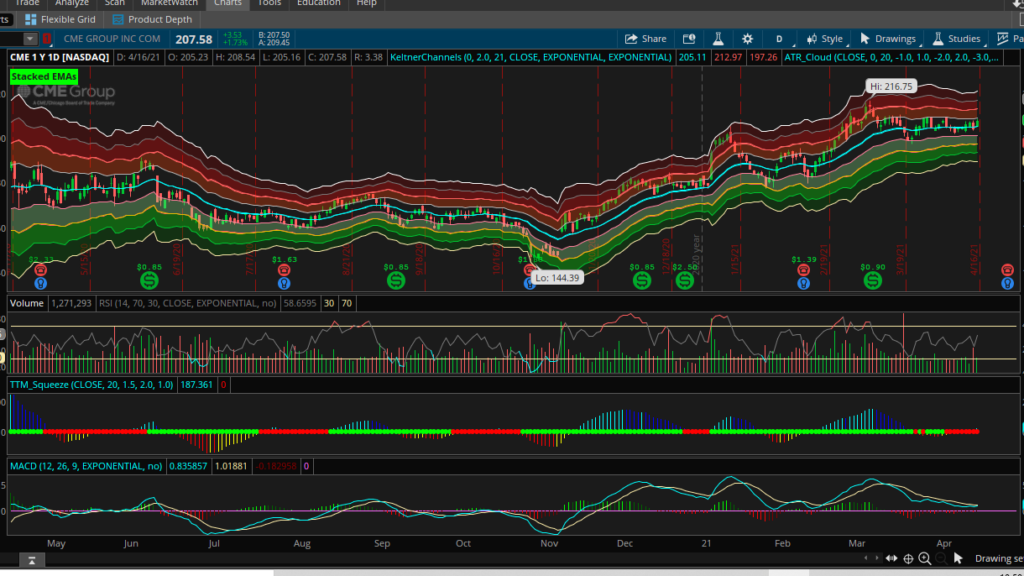
This study draws clouds from 1 to 4 ATR and -1 to -4 ATR so you can easily see where an underlying is trading compared to its average range.